I focus on solving problems for a living. One way I attempt to solve problems in my work is through data and problem analysis. As I continue on my fitness journey, one thing that is important is that I continue to find ways to maximize my workouts so I can continue to progress and achieve new goals.
I currently train across two focus areas, Aerobic state and Anaerobic state. In Aerobic (heart rate zone) training you focus on hitting an optimal work intensity where you can maintain an aerobic state of burning oxygen and fat for fuel. This type of workout is ideal to help you gain endurance providing the ability to work hard for long periods. Here you focus on training the slow twitch muscles.
The second focus area is on the Anaerobic state, where your burning glucose and glycogen as fuel in the absence of oxygen. When you’re in this state is when you generate lactic acid that causes the burning sensation and heavy legs if your body is not able to clear the lactic acid quick enough. In this training area you are focusing on the fast twitch muscles.
Now you may be wondering why I focus on both aspects of training. Well for me I want to be able to ride long sustained rides or runs and have the ability to burst and sprint as needed to achieve my goals. One quick way to tell how well trained you are is to do long rides of 90 minutes or more. If you can’t make it, then you need to focus on heart rate zone training.
The other test is run up a few flights of stairs and see how you feel. If you felt completely out of breath and exhausted from climbing the stairs, then you need to work on HIIT and Tabata style training to help you achieve more when you’re in an anaerobic state.
One way to gain better visibility into your max aerobic and anaerobic states is through a VO2 max test and a Lactate Threshold test. The VO2 max test, known as maximal oxygen uptake, is the measurement of the maximum amount of oxygen a person can utilize during intense exercise. The lactate threshold test helps you identify the point where lactate builds up in the muscles faster than it can be removed. While both these tests help gain knowledge on your current limits your body will vary over time as you continue to train or as your body is under different levels of hydration, stress, and recovery.
I started to investigate real-time methods to determine when I am at the maximum point in an aerobic exercise where I run the risk of entering an anaerobic state. In Heart Rate Endurance zone training I want to work at the high end of my aerobic state without exceeding. In Interval training I want to ensure I push into an anaerobic state and that my legs can quickly recover and flush out the lactate acid.
In my research I started reading up on monitoring muscle oxygenation (SmO2). By monitoring muscle oxygenation in real time, you can determine the state of oxygen delivery and oxygen consumption that is happening in the muscles. Curious I started leveraging this aspect on my Peloton Bike and Peloton Tread workouts.
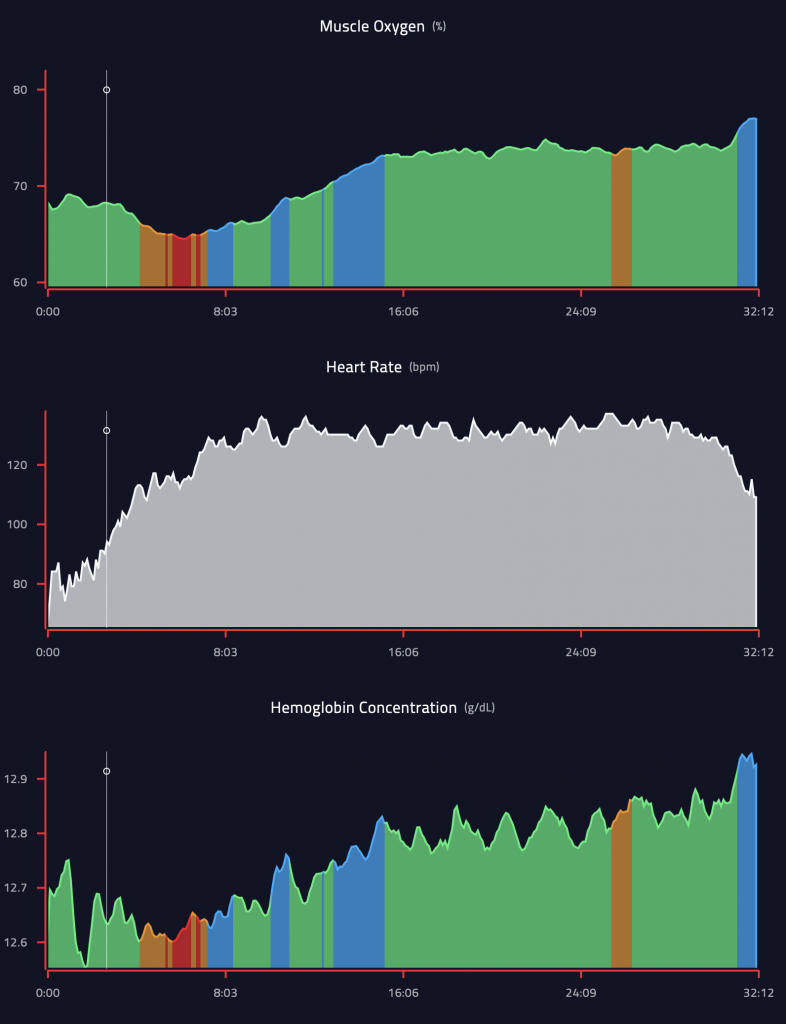
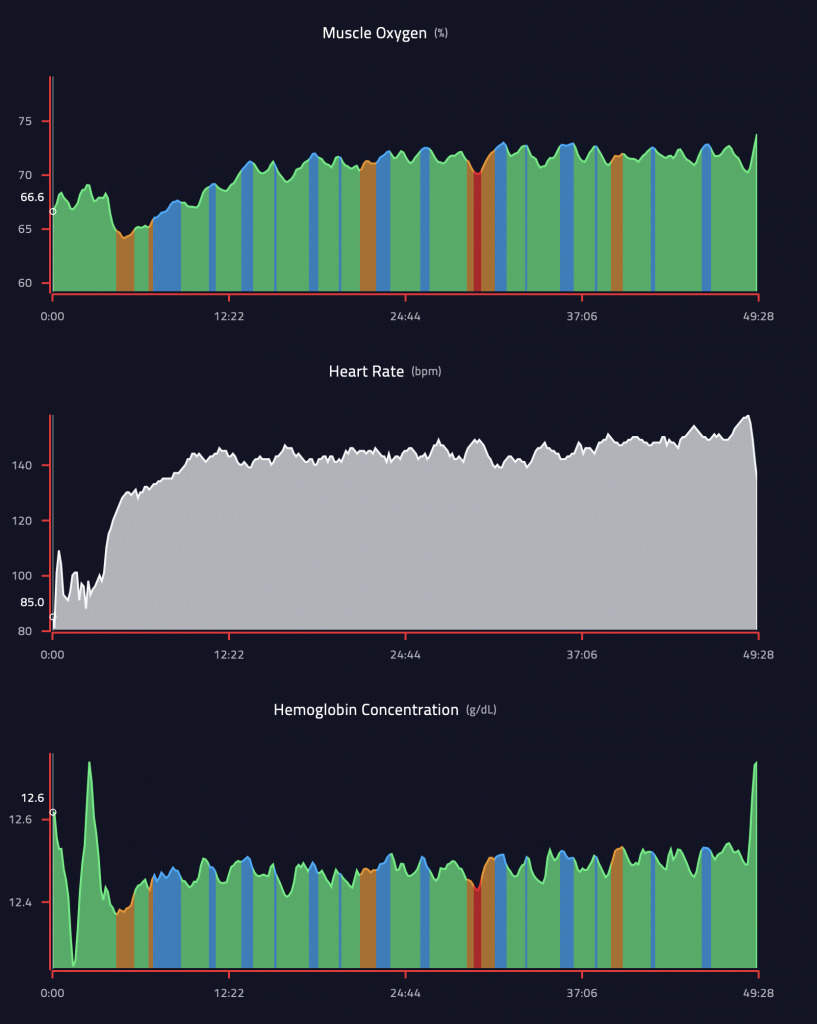
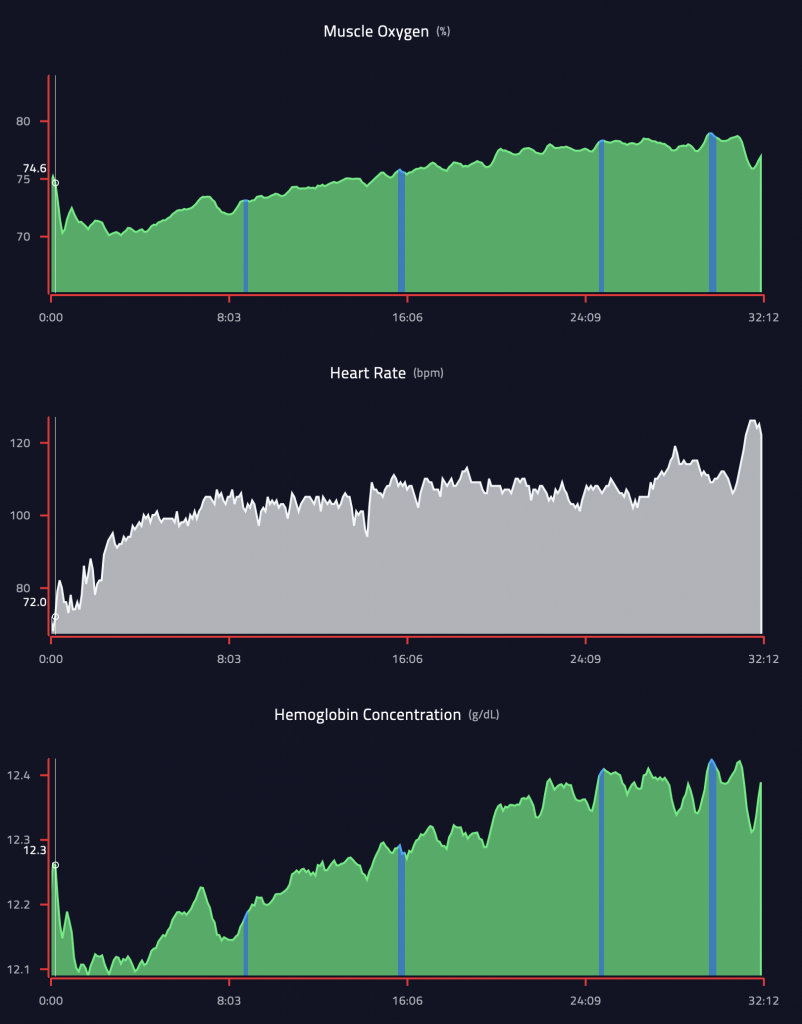
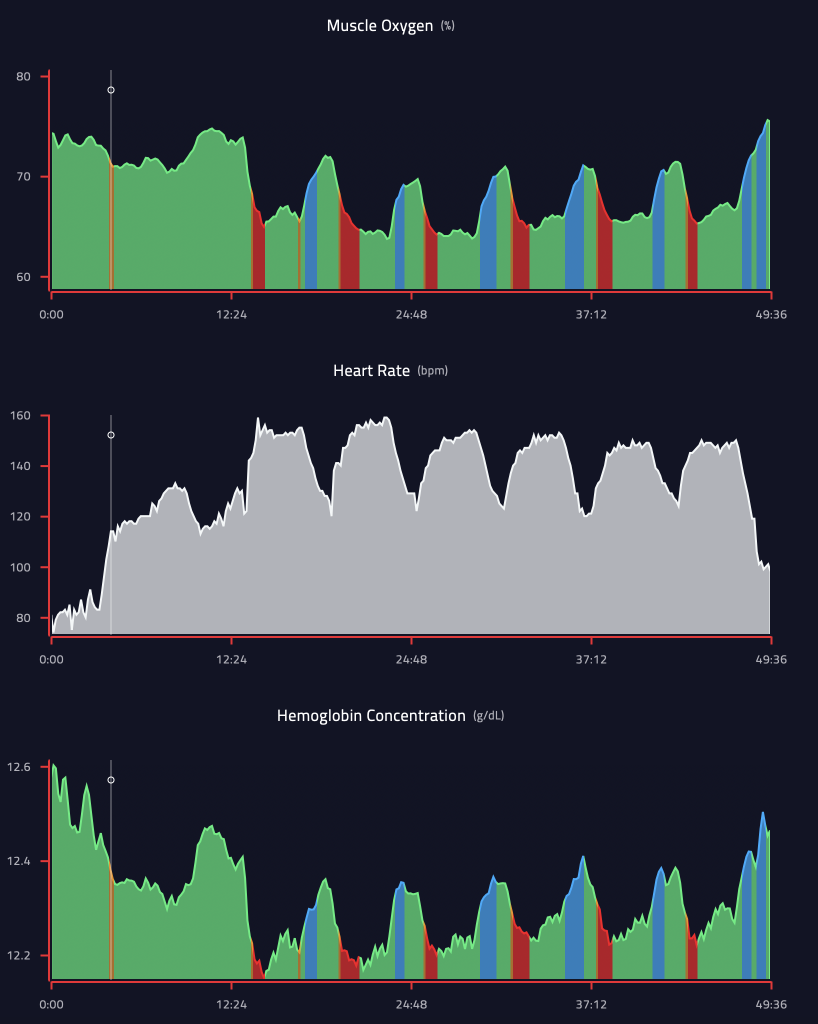
- Increasing Smo2 (Blue) = greater muscle oxygen delivery compared to consumption.
- Steady Smo2 (Green) = balance between the muscle oxygen being delivered and consumed.
- Decreasing Sm02 (Orange as your approaching the limit, Red as you have hit your limit) = greater muscle oxygen consumption compared to delivery.
Since November of 2018 I have started tracking my Endurance training and HIIT/Interval style training with a muscle oxygenation sensor to help see how my muscles are responding to training. So far I have seen improvements and feel like I have been able to maximize my workouts over the past several months. One of the interesting things that I have learned through the process is if I really want to maximize the workouts I need to start with at least a 20-minute warmup to get the blood flowing and my muscles ready for the workouts.
In the following two charts what you will see is a breakdown of my 30-minute warmup workout followed by a 45-minute endurance style workout. Based on my previous training I am finding that my optimal muscle oxygen levels with the sensor I am using should range between 75% to 78%. Once I am at that level I am ready to start my main workouts.
In the first chart you can see my progression through the warmup phase. These workouts were on the Peloton bike, and as you can see in the chart I started just under 70% muscle oxygen. As I warmed up, I increased my heart rate and muscle oxygen and started to stabilize around the 16-minute point. I have found that for me I need at least a 15 to 20-minute warmup before I can really push hard on a strong workout.
Heart Rate Endurance Zone Training

In the second chart, I quickly jumped into a 45-minute Power Zone Endurance ride. In this ride, we focused on driving a steady power output with several moderate increases in speed and cadence to provide a challenge to the muscles. As you can see in the chart, I was mostly consistent through the ride, and as a few various points, you can see I was reaching the breaking point. In this case I backed off slightly and was able to maximize my heart rate training workout and keeping within an aerobic state.

HIIT / Interval Based Training
In this third chart, you can see a standard warmup, very similar to the warmup that I took in preparation for the long endurance ride. In this case, I was preparing for a Tabata style ride and really pushing myself hard during the many Tabata pushes. In this warmup, you can see it actually took me 25 minutes to get warmed up before I was ready to really push.

In this fourth chart what we are looking at is the result of a 6-set Tabata ride consisting of 20-seconds on and 10-seconds of rest done 8 times in the 4 minutes of work. In all 8 pushes I was able to hit maximum effort but with only 10 seconds of rest the body did not have time to recovery. Once the 8 pushes were complete you can see I recovery quickly and was ready for the next Tabata effort.

These two training approaches have helped me hit improve my heart rate zones and high-intensity efforts. The ability to monitor how my body is reacting to my training in real time for me is well worth the experiment and something that I will continue to do as part of my training routine. Below is the Muscle Oxygen monitor and Heart rate Monitor I have been using. I have been providing some product feedback to Human on their user interface and they have been very responsive. If you’re interested Humon gave me a discount code below that you can use if you want to purchase one.
Humon Muscle Oxygen Monitor – (Get 10% off if you use code “HPP-ROBERT10″) http://www.humon.io
Scosche Rhythm 24 Heart Rate Monitor – http://www.scosche.com
Stay tuned as I continue to experiment and learn more over the next few months.
Catch you on the leaderboard!!
Rob – #NeverStop
P.S. – My next step is to see if I can import the data into some type of machine learning model to see if I can identify additional areas of improvement.


